

Bosch Siemens and Nestlé Digital Supply Chain Transformation Case
-

2024-06-24
-

FMCG
Content Guide:
Bosch Siemens (BSH) Company Case Study and Insights:
Introduction of External Data Sources:BSH has integrated external data sources such as Google Trends, Oxford, GFK, Deb Nomics, and Amazon into its supply chain management, enabling an outside-in demand sensing approach.
Demand Prediction Enhancement:By calculating the time and quantity changes in demand, BSH discovered that only 50% of products are predictable at the SKU level. By incorporating advanced forecasting methods like machine learning and external data, the prediction accuracy has significantly improved.
Automated Monthly Demand Forecasting:BSH uses hundreds of external indicators to automate monthly demand forecasting. A case with the Spanish Consumer Price Index revealed the leading/lagging correlation between indicators and demand.
Country-Specific Influences on Demand:Factors such as price, economy, sales, and social media impact demand differently in countries like Germany, the UK, and Turkey. BSH's predictive models have achieved near-program accuracy in multiple European countries.
Bullwhip Effect Mitigation:By comparing sales and shipment volumes, BSH identified a significant bullwhip effect (amplification factor of 2.08). However, upstream in the supply chain, the amplification factor reduced to 1.35, indicating BSH's internal operations mitigated the fluctuations to some extent.
Global Demand Forecasting Project:BSH's demand forecasting project is being promoted globally, attracting attention from various departments. However, challenges such as mindset changes and process rigidity remain, requiring management push and full participation from all employees.
Nestlé Company Case Exploration and Practice:
Prototype Validation with New Product Demand Forecasting:Margot, a supply chain analyst at Nestlé USA, collaborated with external experts to use new product demand forecasting as an entry point for prototyping the outside-in approach.
Noise in Order and Shipment Data:Order and shipment data contain significant noise and deviate from consumer demand. Walmart store retail data reflects demand more directly but had not been fully utilized before.
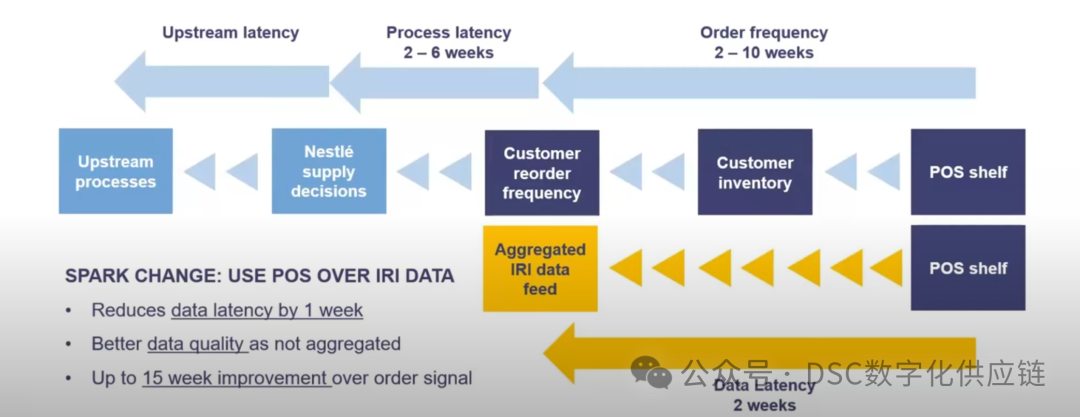
Demand Flow Mapping:Through process mapping, Margot constructed a demand flow, identifying the flow and latency of critical data needed for decision-making across different roles. External data can reduce latency from 2-6 weeks to near real-time.
Role-Specific Decision Perspectives:Through interviews, Margot outlined the decision perspectives and key issues of different roles in the new product launch process (question grid) and developed role-specific visualization dashboards.
Channel Inventory and Market Performance:During the initial stage of new product launches, order data often exceeds actual retail data, forming channel inventory. By combining Nestlé's internal inventory data, the actual market performance of new products can be assessed to avoid overproduction.
Promotional Activity Impact Simulation:Simulations analyzed the impact of promotional activities (social media, buy-one-get-one-free) on overall financial metrics, providing strong support for marketing decisions. It also considered factors like raw material constraints to enhance departmental collaboration.
Integration of Advanced Analytics:Nestlé is gradually integrating advanced analytics into daily operations, including reconstructing statistical forecasts using Azure machine learning and testing with external economic and sales data. The transformation is progressing in three parallel streams, step by step.
In recent years, the digital wave represented by big data and artificial intelligence has swept across the globe, bringing unprecedented opportunities and challenges to production operations and supply chain management for enterprises. This is particularly true in industries such as Fast-Moving Consumer Goods (FMCG), where product life cycles are short, demand changes rapidly, and channels are complex and volatile. Traditional supply chain management models are no longer sustainable. More and more companies realize that digital transformation of the supply chain is imperative, and how to achieve agile, precise, and efficient demand sensing and fulfillment through digital means is key to determining a company's supply chain competitiveness.
Against this backdrop, two globally renowned FMCG companies—Germany's Bosch-Siemens Home Appliances (BSH) and Switzerland's Nestlé—have conducted highly effective digital explorations and practices in demand forecasting and supply chain management in recent years, setting a benchmark for the industry. They start from customer and consumer needs, make full use of external data, optimize end-to-end business processes, reshape digital talent teams, and drive revolutionary changes in supply chain management concepts, methods, and tools, giving the companies wings to soar.
BSH data scientist Ms. Barl Boya and Nestlé senior analytics director Ms. Margot Cohen were invited to share typical cases and practical insights from their companies at an industry conference. Let us delve into their presentations, appreciate the revolution in demand sensing and the magic of end-to-end process reengineering, and unveil the mystery of digital transformation in the FMCG supply chain, providing ideas and inspiration for more companies aspiring to transform.
The Revolution in Demand Sensing: Bosch Siemens’ Outside-In Practice
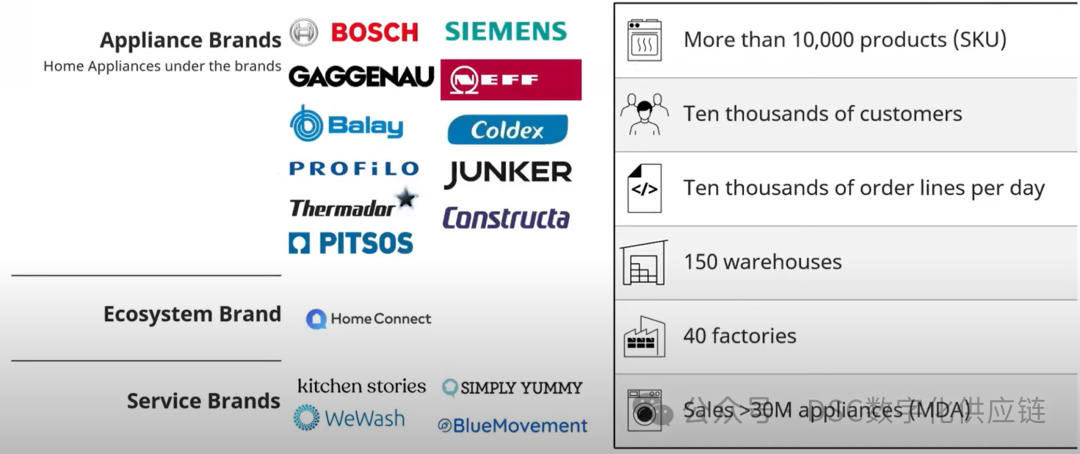
As one of Europe's largest home appliance manufacturers, BSH owns renowned brands such as Bosch, Siemens, and Gaggenau, with products covering cooking, baking, washing, and refrigeration, and over 10,000 SKUs. Facing the characteristics of the home appliance industry such as changing demand, short life cycles, and frequent promotions, BSH has been striving to find more agile and accurate methods for demand sensing and forecasting. In recent years, the BSH supply chain team launched the Outside-In Demand Management project, starting from external data and customer insights, utilizing advanced algorithms like machine learning to reconstruct the concepts and methods of demand forecasting, and achieving good results.
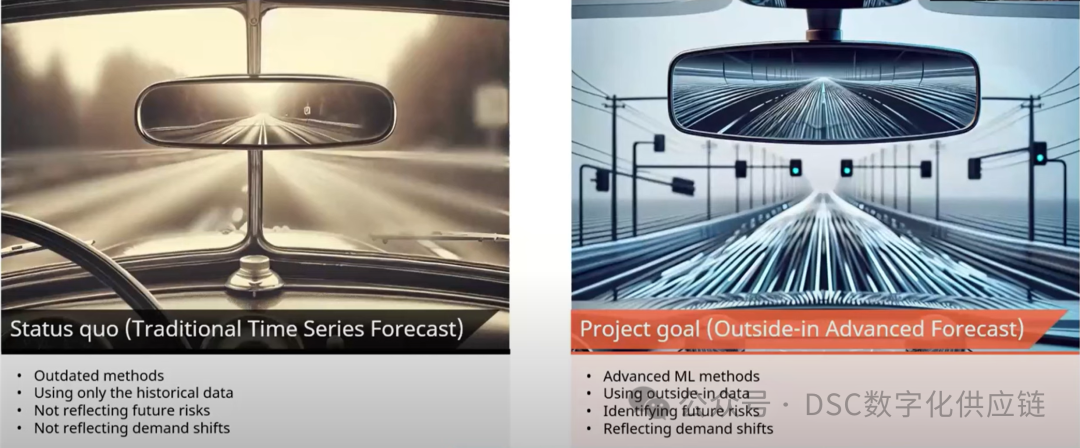
Barl used a vivid metaphor to explain BSH's motivation for transformation. She compared traditional demand forecasting based on historical data to driving an "old car" with only a rearview mirror, unable to see the road ahead, traffic lights, and signs. In contrast, the advanced outside-in forecasting method is like driving a high-tech "smart car," with a dashboard displaying real-time road conditions and intelligently planning the route. BSH chose to proactively transform to shift from "rearview mirror" passive forecasting to "dashboard" active sensing.
But the road to transformation is full of challenges. BSH discovered that after analyzing the predictability of product granularity, 50% of products at the SKU-warehouse level exhibited intermittent, lumpy demand patterns, making traditional time series forecasting models ineffective at accurately capturing demand trends. Past forecasting efforts focused on short-term execution, neglecting forward-looking analysis of medium- to long-term market trends, making it difficult to predict overall industry development. Additionally, the lead time from order placement to delivery often spanned several weeks. By the time demand signals reached the upstream supply chain, demand trends could have already shifted, resulting in forecasts being out of sync with the market.
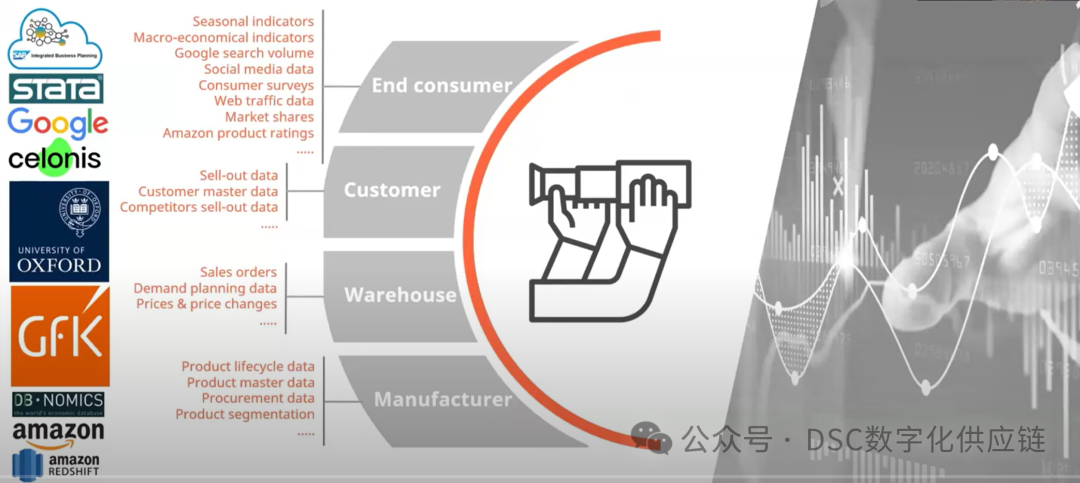
BSH realized that to break free from the "bottleneck" of historical data, it was essential to broaden their data perspective and incorporate various information influencing market demand. Through external partnerships, BSH acquired hundreds of external indicators, including Google search trends, competitor sales data at major retailers (provided by GfK), Oxford economic forecasts, and Deb Nomics macroeconomic data. These covered multiple dimensions such as search popularity, competitive performance, and economic conditions. Combined with BSH's internal data like BOM, ordering, and shipping information, these formed the "data pool" for outside-in demand sensing. BSH used automated processes to aggregate, clean, and integrate external data at different granularities, matching it with internal data to create a unified master data view. This laid a solid data foundation for reducing forecast latency and improving accuracy.
However, simply introducing external data wasn't enough; BSH also needed to break down data silos between departments to enable horizontal data flow and business collaboration. This required sales, marketing, finance, and supply chain departments to work together, establishing a unified data standard and language system to create an end-to-end, omni-channel market insight. BSH organized a cross-departmental demand sensing project team, including market managers, sales and financial analysts, demand planners, and big data engineers. The project team held regular workshops to gather perspectives and reach a consensus on data management and application. For instance, the sales and marketing departments distilled market insights from channel retail data and promotional plans and shared them with the supply chain department for analysis. The finance department provided constraints on demand forecasting from a profitability perspective and monitored the impact of forecast deviations on cash flow and inventory. By pooling their wisdom, they formed a comprehensive, multi-dimensional market demand landscape.
Once data was integrated, BSH began analyzing demand influencing factors and their mechanisms from macro to micro levels. On one hand, BSH used high-frequency data like Google search indices and macroeconomic indicators as leading indicators, assessing their correlation with overall market demand over a future period to grasp industry trends. On the other hand, for key products, BSH analyzed the micro-level correlation between demand and specific marketing activities, seasonality, and unexpected events, revealing the causes of demand. The case of the Spanish market is particularly noteworthy. By cross-analyzing BSH's monthly sales in Spain with the Spanish Consumer Price Index, BSH found a significant negative correlation between the two time series. This indicated that rising consumer prices often led to a decline in demand for discretionary consumer goods like home appliances. Further analysis showed that the price index led sales by about two months. This discovery provided BSH with an important leading indicator, allowing them to anticipate demand changes and plan production and inventory in advance. Through systematically implementing a combined macro-micro insight approach, BSH built a keen "Hoffman Demand Radar," significantly enhancing the breadth and depth of market sensing.
Building upon the integration of data and processes, BSH embarked on introducing advanced algorithms such as machine learning to fully leverage the predictive value of external data and overcome the limitations of traditional time series models. Given that 50% of products exhibited non-smooth demand at the SKU level, BSH initially employed classification algorithms to differentiate between smooth and intermittent demand products. Subsequently, they applied suitable forecasting models tailored to each category. For products with smooth demand, BSH utilized regression models based on external factors, considering influences like pricing, promotions, seasonality, and search trends. For products with intermittent demand, BSH innovatively employed a two-stage modeling approach: first using binary classification models to predict whether demand would occur in a future month, followed by multivariate regression models to forecast the specific demand quantity.
This divide-and-conquer, demand-driven modeling strategy enabled BSH to increase SKU-level predictability from 50% to 80% without sacrificing granularity. Notably, BSH automated the construction, training, evaluation, and deployment of forecasting algorithms and models through cloud platforms, significantly enhancing forecast efficiency. The entire automated forecasting process could be completed within 4-5 hours, providing near real-time decision support to business units and allowing continuous optimization and updates based on feedback.
During the rollout of outside-in forecasting practices, BSH carefully considered the market differences across various countries. Using visualization tools like heatmaps, BSH discovered that pricing was the primary driver of demand in the German market, followed by social media reputation, whereas macroeconomic factors had a more significant impact in Turkey, and retailer sales data served as a key indicator in the UK. Tailoring models accordingly to these regional variations, BSH incorporated local-specific indicators, showcasing the expansiveness and applicability of the outside-in concept. Currently, BSH has implemented outside-in demand forecasting in major European markets such as Germany, the UK, Spain, and Turkey, covering nearly two-thirds of the company's sales. Next steps include expanding these practices to overseas markets such as the United States and China to elevate global supply chain management standards.
After nearly two years of relentless effort, BSH's outside-in demand forecasting has made significant strides across key metrics. Overall, advanced models have achieved forecast accuracy rates 10-20 percentage points higher than traditional time series methods, narrowing the gap with manual planning to within 5%. In mature markets like Germany, the Forecast Value Add (FVA) from forecasts even exceeded that of manual planning. Moreover, the new methods have reduced demand forecasting latency from 1-2 months to within 2 weeks, significantly enhancing forecast timeliness. Combined with proactive "telescope" analysis conducted 1-3 months in advance, BSH can make more timely, accurate, and forward-looking judgments on market demand, swiftly transmitting insights across various segments of the supply chain. As a result, the cycle from order placement to delivery has been substantially shortened, achieving more balanced inventory levels and notably improving delivery rates and user experience.
Despite the initial success of outside-in demand forecasting, BSH faces several challenges in its global deployment. On one hand, entrenched traditional views emphasizing "actual orders as the main focus" pose skepticism towards data-driven demand insights among many business units, perceiving them as disconnected from reality. BSH's demand management team has invested considerable effort in fostering digital thinking among business units through training, workshops, and empirical evidence, aiming to earn their trust through project outcomes and benefits. On the other hand, truly embedding advanced outside-in concepts into BSH's business processes requires standardizing and solidifying numerous operational mechanisms. This entails establishing unified master data management standards, formalizing processes for external data collection, integration, and analysis, defining cross-departmental collaboration rules, simplifying human-machine interface interactions, and more. Such efforts demand top-level design and long-term investment and cannot be achieved overnight. BSH is developing a 3-5 year plan to progressively advance these changes in phases, striving to establish outside-in demand management as an indispensable "standard component" of their business processes and a shining beacon in BSH's digital transformation of the supply chain.
End-to-End Process Reengineering: Nestle's Digital Transformation Journey
As the world's largest food and beverage company, Nestle boasts over 2,000 brands and more than 120,000 SKUs globally, spanning categories such as coffee, dairy products, pet food, and nutrition supplements. The complexity of Nestle's extensive product portfolio poses significant challenges for demand management and supply chain coordination. To address this, Nestle's supply chain team collaborated with sales, marketing, and other departments, focusing on new product launch management as a starting point to initiate an end-to-end process reengineering journey.
Nestle leveraged external retail data extensively to establish a seamless "demand flow" from suppliers to retail stores. They developed visual decision support tools tailored for key roles including product managers, sales, finance, and supply chain, facilitating integrated decision-making. Through this business-finance integration, Nestle achieved synchronized supply and demand and optimized marketing strategies, empowering successful product launches.
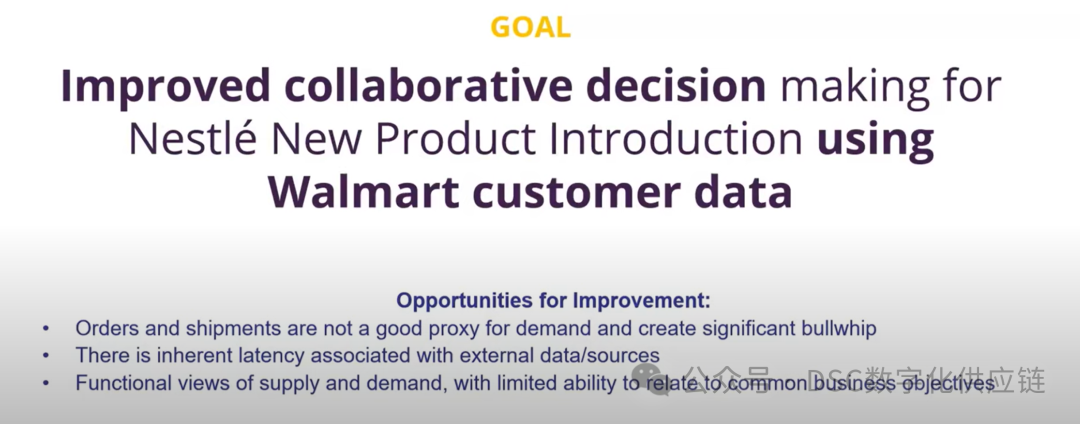
With over 100 new products introduced annually and product lifecycles often lasting only 6-12 months, Nestle recognized the critical need to swiftly gauge market responses during initial product launches. Timely adjustments in marketing mixes and supply strategies are pivotal for brand success and profitability. However, Nestle identified severe information mismatches and asymmetries in traditional new product launch management processes. On one hand, the company heavily relied on distributor order data which often lagged behind actual consumer demand by weeks and was distorted by channel inventories, thus failing to reflect true end-customer needs. On the other hand, internal departments at Nestle maintained fragmented data silos, lacking horizontal integration and timely insights into current and future demands. By the time supply-demand imbalances surfaced, it often became too late to proactively address issues.
Recognizing the urgency to break down inter-departmental information barriers, Nestle emphasized leveraging external retail data to achieve an end-to-end, holistic approach. This initiative not only addressed existing challenges but also served as a breakthrough opportunity. Capitalizing on the new product launch as a catalyst, Nestle partnered with external software vendors and industry experts to embark on a digital transformation project aimed at restructuring their demand sensing processes and enhancing end-to-end supply chain coordination capabilities.
As the world's largest food and beverage company, Nestle manages over 2,000 brands and more than 120,000 SKUs globally across categories such as coffee, dairy products, pet food, and nutrition supplements. The complexity of Nestle's extensive product portfolio presents significant challenges for demand management and supply chain coordination. To tackle this, Nestle's supply chain team collaborated with sales, marketing, and other departments, focusing on new product launch management as a starting point for an end-to-end process reengineering journey.
Nestle began by systematically mapping the end-to-end process of new product launches and constructing a "demand flow". Through in-depth interviews with product managers, sales teams, finance, and supply chain representatives, Nestle gained a comprehensive understanding of the entire lifecycle of new products from concept to market launch. They meticulously dissected decision-making logic and information needs at key milestones. Based on this foundation, the project team created a vivid "demand flow" diagram. This visual representation vividly illustrates the movement of raw materials, packaging, finished products within and outside the supply chain, as well as how different roles access and utilize demand signals. Crucial decision points, such as inventory decisions upon initial market entry and reordering decisions within the first month post-launch, are clearly marked on the diagram. The project team also identified weak links such as data silos and decision blind spots using different symbols. The entire "demand flow" diagram provides an intuitive panoramic view of new product launches, serving as a "strategic map" to facilitate consensus and collaboration across departments.
To pinpoint the specific pain points of various roles more accurately, Nestle innovatively employed the "Question Grid" method. Representatives from product management, sales, finance, and supply chain departments were invited to pose questions related to critical decisions in new product launch management where they sought data support and analytical insights. For instance, product managers were most concerned about achieving first-month sales targets and rapidly enhancing brand awareness, while sales directors focused on distribution in various regions and stores and the performance of competing products. Financial analysts needed insights into the impact of new products on category profit margins, and supply chain managers sought to determine optimal timing for second-round production orders and balance cash flow and inventory risks. Through the Question Grid, Nestle developed a comprehensive, multi-layered profile of requirements spanning strategic, tactical, and execution levels. These requirements function like spotlights guiding Nestle to define the direction and focus of its digital transformation. Based on this, the project team planned data collection, management, analysis, and application strategies for each segment of the end-to-end process, ensuring robust support for business decisions.
To complete the end-to-end information chain, Nestle actively embraced external data sources. POS (Point of Sale) data at the store level emerged as a crown jewel for capturing genuine consumer demand. Thanks to strategic partnerships with major clients like Walmart, Carrefour, and IKEA, Nestle acquired daily sales data at the SKU level for key categories in these stores, covering over 70% of its sales in the U.S. market. These data sources formed a solid foundation for accurately sensing demand.
Furthermore, Nestle integrated digital channel data from social media, search engines, and e-commerce platforms to analyze consumer preferences and latent demands. For example, analyzing product search volumes and user reviews allowed Nestle to promptly gauge consumer preferences for new products and identify issues related to taste, packaging, and other aspects for continuous improvement. Leveraging loyalty program data enabled Nestle to identify high-value consumers for more targeted marketing efforts. Nestle also extensively utilized external data to assess economic conditions and competitive dynamics' impact on demand. The market analysis team regularly monitored macroeconomic indicators such as industry sentiment indices and consumer confidence indices, correlating them with internal sales data to promptly alert potential demand shifts. They also obtained information on competitors' launch plans and promotional schedules to assess their impact on Nestle's market share. External data greatly expanded Nestle's market insights, enabling proactive strategies and gaining competitive advantages.
By mastering external retail data, Nestle achieved transparent inventory management, balancing new product promotions with supply guarantees. Traditional new product management primarily focused on Nestle's and distributors' warehouse inventories, lacking visibility into downstream stores and suffering from severe information delays. With SKU-level store sales and inventory data in hand, Nestle could accurately calculate Days of Supply Inventory (DSI) for new products across different sales regions and customers. Comparing these with Nestle's warehouse DSI metrics allowed them to assess channel inventory health directly. Based on POS data, Nestle benchmarked against competitors' performance, promptly identifying risks such as slow-moving products or uneven distribution, optimizing distribution timing, and avoiding channel overstock. Sales teams used this data to communicate promptly with distributors and stores to understand underlying reasons and, if necessary, coordinate product recalls or promotional discounts. Concurrently, Nestle's supply chain team adjusted material procurement and production schedules in response to terminal demand changes reflected in POS data, ensuring adequate supply without overstocking. In summary, sell-out data from stores and channel inventory data acted as mirrors connecting Nestle's finance, sales, and supply chain departments horizontally, promptly detecting discrepancies between supply and demand, taking early action, and achieving dynamic balance between promoting new products and risk management. The application of predictive analytics tools enabled departments to form proactive, holistic judgments about future demand, smoothing supply-demand rhythms and reducing the bullwhip effect, achieving higher customer service levels at lower costs.
In addition to demand-supply coordination, precise financial analysis plays a critical role in the successful launch of new products. Previously, Nestle faced challenges in devising new product promotion strategies due to a lack of timely and accurate data on marketing expenditures and returns on investment (ROI), often leading to risks of blind discounting and profit erosion. The finance department only observed the impact of promotional activities on category gross margins post-factum, lacking predictive capabilities. Today, Nestle has integrated POS data, e-commerce data, and other external sources with internal data on marketing expenses, pricing, and gross margins, establishing a quantitative marketing decision analysis tool.
Using this tool, the marketing department can compare the sales uplift effects of different promotions (such as buy-one-get-one-free, social media campaigns, etc.), weigh the ROI factors like promotion intensity, duration, and coverage, and assess potential brand and category P&L impacts. Furthermore, the marketing and finance departments collaborate on demand simulation analysis. Based on parameters like demand elasticity, they design multiple pricing, promotion, and advertising combinations, predicting sales revenue, gross profit, cash flow, etc., under different hypothetical scenarios. Executives such as product managers, marketing directors, and CFOs can weigh pros and cons during scenario simulations, selecting marketing combinations that maximize overall profitability. The supply chain team can also optimize stocking and logistics plans accordingly, maximizing market demand fulfillment. This integration of business and finance-led quantitative analysis ensures Nestle makes precise marketing decisions, driving sales growth while maintaining financial robustness, avoiding indiscriminate spending, and steering clear of detrimental scenarios.
The convergence of business and finance, guided by quantitative analysis, is pivotal in Nestle's ongoing success and sustainable competitive advantage. As Nestle progresses in its end-to-end process reengineering, it emphasizes talent development and team building to foster a versatile workforce blending business acumen with digital skills. The company prioritizes enhancing digital capabilities among core business personnel through regular digital transformation training sessions. External experts share cutting-edge concepts and practices in digital supply chain management, aiding departments in understanding the value of external data and mastering visualization tools. Nestle also organizes joint workshops involving supply chain, sales, and marketing departments, enhancing collaboration through real-world projects and refining work methodologies. This initiative has nurtured a cadre of digitally adept business leaders driving transformative change.
Furthermore, Nestle strengthens integration between business units and IT departments. Agile project teams comprising business experts and data engineers collaborate under the "Pizza Team" model, empowered for rapid iteration and continuous improvement of digital solutions. Business experts translate end-to-end process expertise into requirements, guiding IT departments in system optimization. Conversely, IT departments impart digital concepts and methods to business experts, fostering mutual understanding and alignment. Nestle's adjusted organizational structure and performance evaluation system, complemented by a dedicated digital transformation office, coordinate efforts across departments in business processes, data governance, and system development. Key roles such as product managers and demand planners have their digital capabilities incorporated into performance metrics, encouraging innovation and transformative practices. This restructured organization underpins seamless collaboration across Nestle, ensuring the effective implementation of digital initiatives.
Nestle's success in digital transformation stems from a progressive, multi-faceted implementation approach. The company employs a phased strategy of "point-line-surface": focusing initially on developing prototypes and piloting in specific business scenarios, expanding horizontally across multiple business areas to formulate comprehensive solutions, and finally scaling operations company-wide. Each step is meticulously planned for swift impact and efficiency. For instance, in managing new product launches, Nestle piloted with its coffee category, selecting representative new products to build end-to-end business processes and system prototypes. Through rapid iteration over 2-3 months, collaborating closely with software vendors, Nestle developed a suite of modules including POS data collection, alert analytics, inventory optimization, and marketing decision support. After refining the prototype system, Nestle swiftly scaled across its coffee category and replicated solutions across other categories like infant formula and pet food, achieving widespread application. Unified data standards and analytical models across categories enabled shared and reusable data assets, further enhancing operational efficiency. Additionally, Nestle actively integrates these systems with ERP and CRM platforms for enhanced business synergy. More departments benefit from digitalization as both recipients and drivers of transformative initiatives.
Throughout its digital journey, Nestle upholds an integrated approach across processes, data, and talent development, ensuring comprehensive progress without neglecting any crucial aspect. For instance, in adopting POS data, the company streamlined standardized processes for data collection, cleansing, and processing, establishing data quality assessment methods and facilitating training for business personnel in data understanding and application. Only through this holistic approach of combining software capabilities with organizational capacity can digital transformation truly take root. With over three years of concerted effort, Nestle's end-to-end process reengineering has already shown promising results: average new product launch cycles reduced by 20%, channel inventory levels lowered by 15%, and out-of-stock rates decreased by 10%. Importantly, Nestle has cultivated a culture of "agile innovation" in digital transformation, laying a solid foundation to meet the ever-changing market demands. Looking ahead, digitalization has become ingrained in Nestle's DNA, serving as a cornerstone for its continued vitality and leadership in the industry. This case undoubtedly offers valuable insights and lessons for other enterprises embarking on their digital transformation journeys.
Conclusion
BSH and Nestle vividly exemplify the typical paths and key principles for advancing supply chain transformation in the digital age for FMCG companies. Despite their different business characteristics and transformation focuses, the underlying logic of their transformations converges, summarized in the following insights:
Firstly, leading with ideology: From inside-out to outside-in, fostering end-to-end collaboration to create overall value. BSH and Nestle share the common feature of re-examining the positioning and boundaries of their supply chains from a strategic perspective when advancing digitization, establishing an "ecosystem" concept and actively integrating into the external environment. They recognize that enterprises are no longer isolated "islands" but nodes in industry and value chains. Breaking down departmental barriers and incorporating an external perspective allows them to grasp market trends, understand customer needs, and lead industry development. This revolution from external to internal thinking is the starting point and destination of supply chain digitization.
Secondly, data-driven: Leveraging external data to reduce latency, achieve real-time perception, and respond quickly. BSH extensively utilizes external data such as Google Trends, competitor sales volumes, and economic indicators to build a demand "stethoscope" covering all categories and markets. Nestle focuses on POS data, achieving "transparency" management from stores to factories. The integration of external and internal data capabilities has qualitatively leapfrogged demand perception abilities at both companies, reducing the lag in demand forecasting from months to weeks, even near real-time. Only by shortening perception latency can they maximize synchronization between supply and demand rhythms in the VUCA era.
Thirdly, process reengineering: Focusing on end-to-end core processes, delineating responsibilities, and optimizing dynamically. In their digital advancement, both BSH and Nestle take an end-to-end perspective, focusing on the core value chain from demand to supply. They systematically clarify the responsibility boundaries and coordination mechanisms of product, sales, and supply chain segments in forecasting, planning, and execution. By building information platforms that span all segments and creating refined analytical tools, they ensure each segment operates efficiently, assumes its responsibilities, and maximizes its strengths. The combination of static collaboration and dynamic optimization is key to enhancing supply chain efficiency and resilience.
Fourthly, digital talent: Blending business and data experts, fostering cross-disciplinary integration and continuous learning and innovation. BSH and Nestle aim to cultivate a versatile talent pool capable of both business expertise and data proficiency. They employ methods such as job rotations, on-site training, and workshops to equip business experts with digital tools and familiarize data experts with business contexts, fostering "resonance" between them. Agile projects and joint workshops provide platforms for deepening understanding and close collaboration in practical scenarios. A talent pool that integrates across disciplines not only ensures effective implementation of digitalization but also injects continuous vitality into transformation efforts. Keeping pace with talent development is essential to preventing digitalization from becoming a passing fad.
Finally, change management: Identifying drivers, respecting expertise, enhancing guidance, employing systematic approaches, and sustaining progress. Initiatives at BSH and Nestle are initiated from senior management, with change leaders appointed at all levels, fostering coordinated advancement vertically and horizontally. Throughout implementation, they prioritize overall planning and top-level design while allowing different business lines to adapt and innovate based on local conditions. By integrating digital transformation into performance systems, quantifying transformation goals, and establishing career development pathways for digital talents, both companies mobilize organizational enthusiasm and overcome resistance to change. Incremental progress, multifaceted approaches, and perseverance are the winning strategies for successful transformation.
===========
This article is sourced from the public account "DSC Digital Supply Chain" and represents the author's viewpoints. For any suggestions or questions, please contact the author directly.
DSC (Digital Supply Chain) is positioned to gather top domestic experts in digitalization and supply chain, jointly exploring professional issues and cutting-edge topics in the field of supply chain, and exploring the development direction of supply chain in the digital domain.
END

Share